Forex Trading Bot
for MT4/MT5
Fully automated trading without any prior experience is possible with the use of AI-powered trading systems.

Transparency
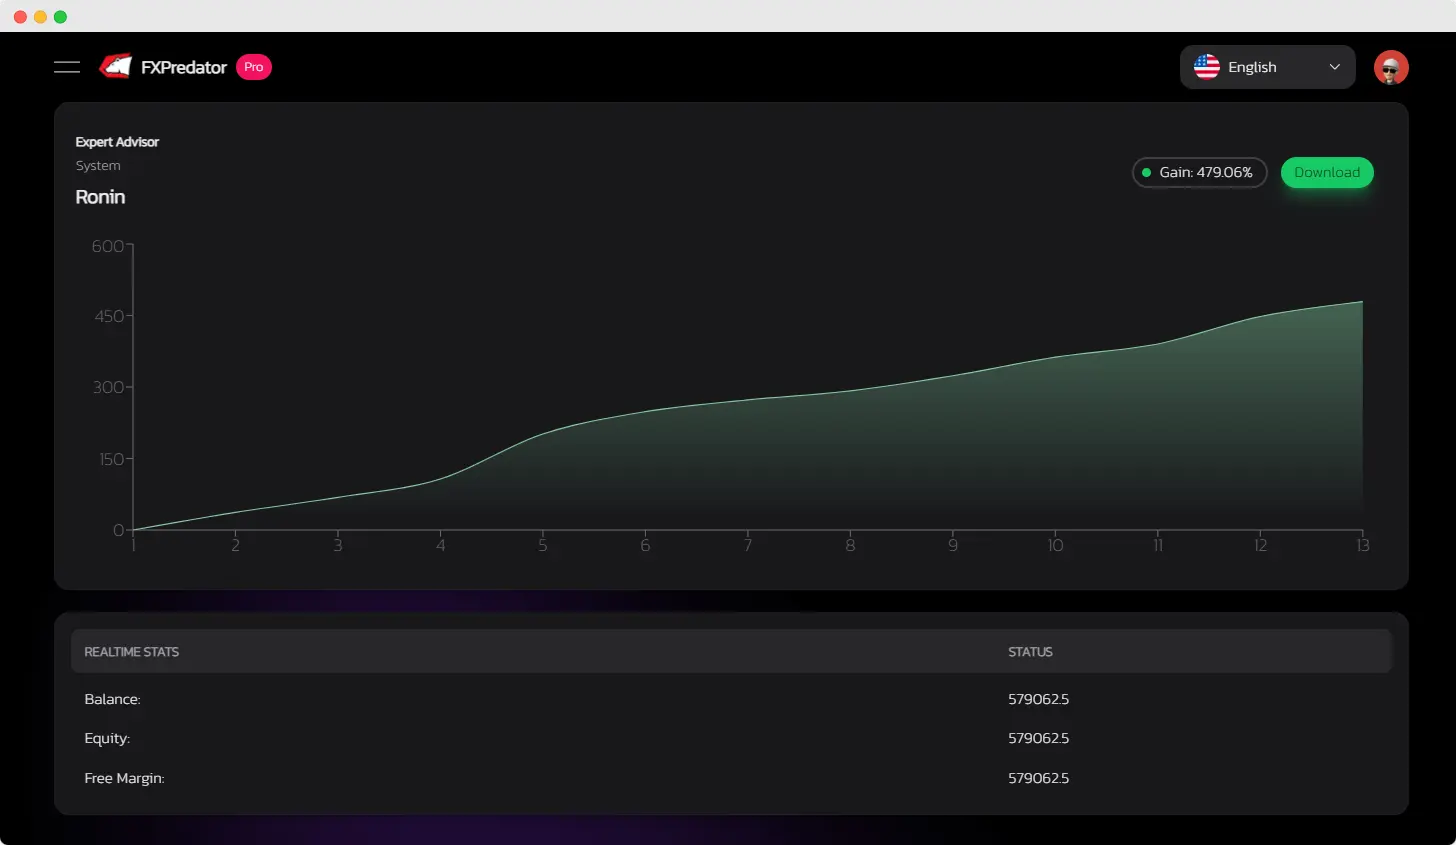
You can track our real-time and historical performance through verified Myfxbook.

Fast Delivery
After upgrading your plan, you can instantly download and install our Expert Advisor.

Support
We prioritize supporting and solving all customer problems first.
Experience the Benefits of FXPredator
Witness the multiple advantages of FXPredator and discover why it is the ultimate solution for automated trading!
Automated Trading
FXPredator operates based solely on numerical data and is fully automated, ensuring accuracy and efficiency in every trade.
Passive Income
Generate a consistent stream of passive income effortlessly with FXPredator, removing the need for manual input.


Proven Performance
Monitor our Expert Advisor’s real-time performance or explore its historical data on myfxbook to see its consistent and reliable track record.
Peace of Mind
Trust the management of all trades to our software, allowing you to focus on important aspects of your life.

Why choose us?
What Makes Our Products the Top Choice among Customers
Established Track Record
Our Products boasts a history that can be checked on our site, demonstrating our dedication to delivering steady and dependable outcomes, thereby gaining the trust of our valuable customers.
Usage of State-of-the-Art Technology
Through the utilization of cutting-edge technology and advanced algorithms, our Products effectively examines market trends to make informed trading decisions.
Customization Choices Available
Customers are impressed by the broad array of customization choices that enable them to modify their trading strategies based on their specific objectives and tolerance levels for risks.
Outstanding Customer Support
Our group of professionals offers extraordinary customer support to guarantee that our customers receive the necessary assistance to maximize the advantages of our Products.
Open a forex account


Unleash the Potential of FXPredator: The Best Expert Advisor for Trading
As the most advanced trading expert adviser available, FXPredator uses cutting edge algorithms to identify lucrative trades with remarkable accuracy. With its reliable performance history and easy-to-use customization options, FXPredator helps traders all around the world increase earnings while lowering risk. Learn how FXPredator can help you and improve your trading efforts.

Frequently Asked Questions
Who is the automated trading system suitable for?
Our automated trading system is suitable for traders of all levels, whether experienced or new to trading, who are seeking tools to enhance their trading capabilities.
What is the minimum capital requirement?
We provide preset examples that traders can utilize for testing and evaluating potential risks across different time periods. It is strongly recommended to thoroughly test these examples before engaging in live trading, ensuring a clear understanding of the initial capital that may be at risk.
How long does it take to download the Expert Advisor?
Once you’ve upgraded to the PRO version, you can instantly access the download page.
Do I need a VPS to run this software?
Yes, we highly recommend using Vultr, specifically located in New York, to run both your MT4/MT5 platform and our Expert Advisor seamlessly. We offer assistance in setting up everything until it operates smoothly.
Latest from the blog
Get Trading Robot
Maximize your trading potential effortlessly with our expert advisors.